Google Charts Available End of March
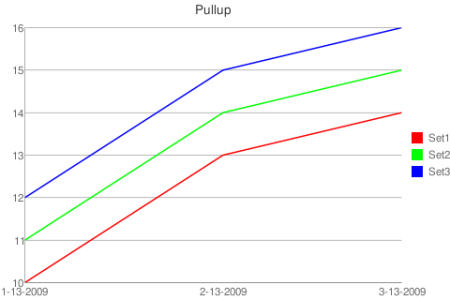
March 17, 2009Many users have asked for the ability to chart progress. Luckily for the Google phone (and any web-enabled phone), we have the Google Charts API which magically much easier to use than I expected. The tricky part was the data scaling especially since we are working with dates. For example, I worked out consistently for a couple of weeks and then skipped a month, I wouldn’t want the data to be displayed in equal intervals. So how do you take dates and figure out the relative distance between them? In this case I just converted everything to milliseconds which is pretty standard. Although at first I tried to come up with my own way to convert dates to a number format which obviously didn’t end up working. I have posted a link below and the chart. Notice how the url contains all the information needed to create the chart, pretty nifty and its fast too!
Here’s a sample

It would be nice to have the option to graph total weight lifted per set rather than just the weight on it’s own. If I’ve managed to go from 3×8 @ 34 -> 3×9 @ 34 that’s still progress and it would be nice to see that on a graph. Perhaps as an option? That would give me more warm fuzzy feelings/motivation.